磷胁迫下羊草的响应及磷响应相关基因表达分析
万东莉1,侯向阳1,丁勇1,任卫波1,王凯1,李西良1,万永青2( )
)
)
Response and the Expression of Pi-Responsive Genes in Leymus chinensis Under Inorganic Phosphate Treatment
WAN DongLi1,HOU XiangYang1,DING Yong1,REN WeiBo1,WANG Kai1,LI XiLiang1,WAN YongQing2()
)
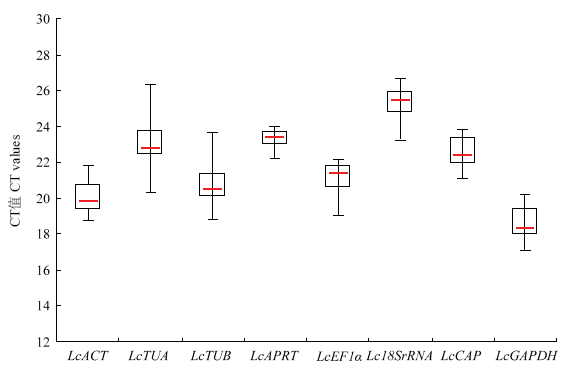
图4. 候选内参基因在所有测试样品中的CT值分布情况
方框代表CT值的第一和第三四分位值;红线代表中位数;短横线代表最大值和最小值
Fig. 4. Distribution of CT values of candidate reference genes across all samples
Boxes represent the first and third quartiles of the data; Red lines across the boxes indicate the median CT values; Short horizontal lines show the maximum and minimum values