施用有机肥对我国作物氮肥利用率影响的整合分析
任科宇1,段英华1( ),徐明岗1,张旭博2()
),徐明岗1,张旭博2()
Effect of Manure Application on Nitrogen Use Efficiency of Crops in China: A Meta-Analysis
REN KeYu1,DUAN YingHua1(),XU MingGang1,ZHANG XuBo2()
),XU MingGang1,ZHANG XuBo2()
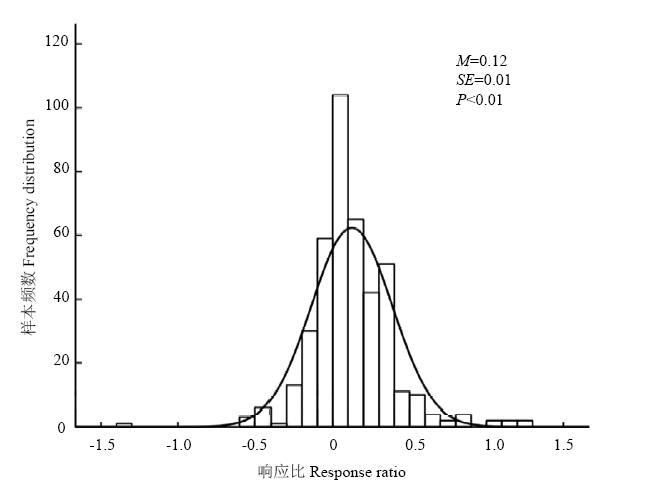
图1. 配施有机肥与单施化肥响应比的频数分布
M 和SE 分别为平均值和标准误;曲线为数据的高斯分布,P 为显著性检验
Fig. 1. Frequency distribution of response ratio between NPKM and NPK
M and SE denote the mean and standard errors, respectively. The curve is a Gaussian distribution fitted to frequency data and P<0.01 suit for the distribution