加拿大一枝黄花石油醚萃取物对福寿螺肝脏的影响
李帅岚,沈校,邹峥嵘( )
)
)
Effect of Petroleum Ether Extract from Solidago canadensis on Liver of Pomacea canaliculata
LI ShuaiLan,SHEN Xiao,ZOU ZhengRong()
)
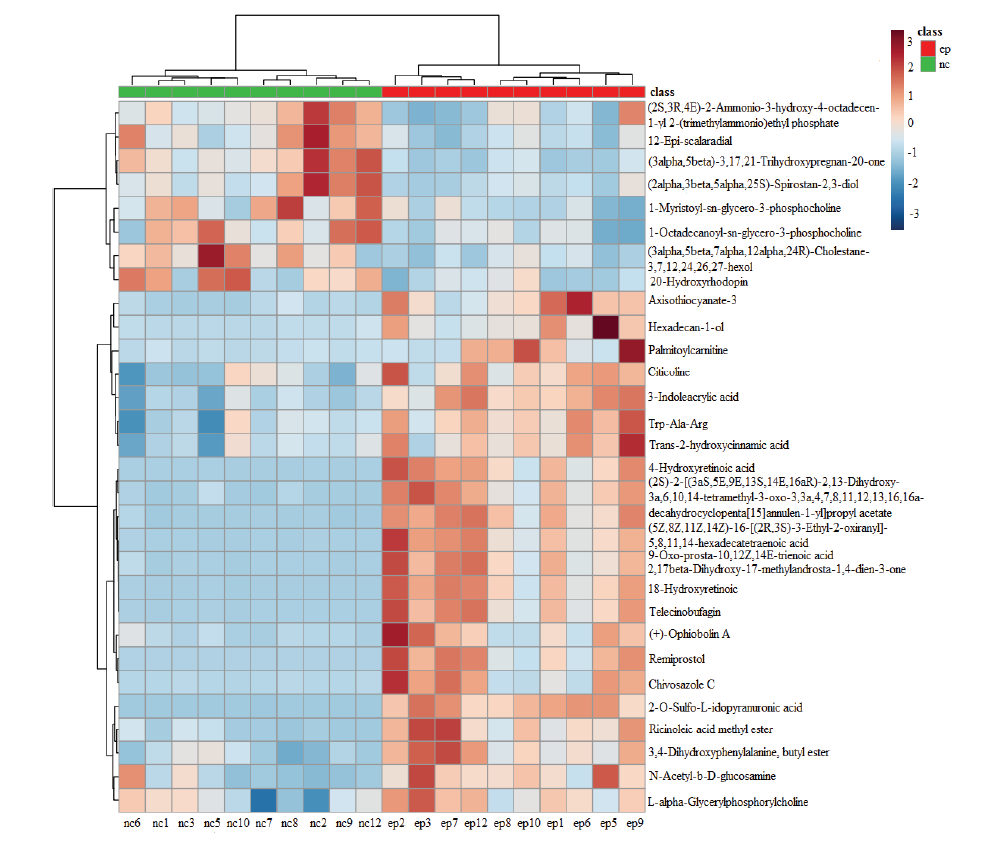
图6. 正离子层次聚类分析图
横坐标代表样品名称及样品的分类,纵坐标代表差异代谢物的聚类结果。颜色代表了代谢物峰强度。所用数据为正离子模式ep组、nc组比较的差异代谢物
Fig. 6. Positive ion hierarchical cluster analysis chart
The abscissa represents the sample name and sample classification. The ordinate represents the clustering results of differential metabolites. Color represents the peak intensity of metabolites. The data used are differential metabolites compared between positive ion mode ep group and nc group