加拿大一枝黄花石油醚萃取物对福寿螺肝脏的影响
李帅岚,沈校,邹峥嵘( )
)
)
Effect of Petroleum Ether Extract from Solidago canadensis on Liver of Pomacea canaliculata
LI ShuaiLan,SHEN Xiao,ZOU ZhengRong()
)
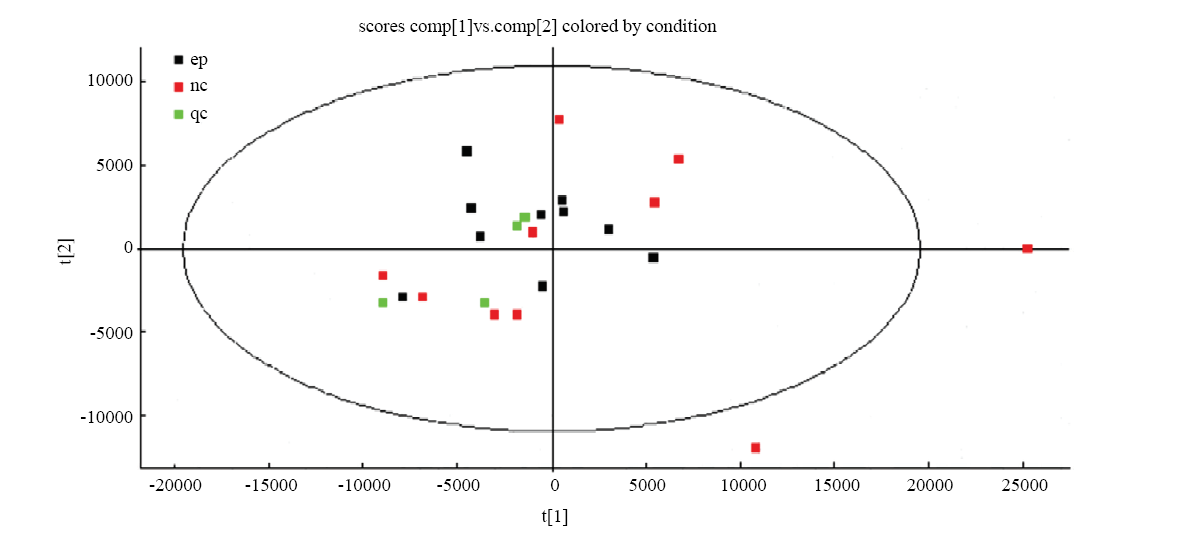
图4. PCA分析图
图中3种颜色分别代
Fig. 4. PCA analysis plot
In the figure, the three colors represent three sample groups, respectively. Each rectangle represents the position projected on the two-dimensional plane after the metabolome dimension reduction treatment of this sample