基于Meta分析中国水稻产量对施肥的响应特征
韩天富1,马常宝2,黄晶1,3,柳开楼1,4,薛彦东2,李冬初1,3,刘立生1,3,张璐1,3,刘淑军1,3,张会民1,3( )
)
)
Variation in Rice Yield Response to Fertilization in China: Meta-analysis
HAN TianFu1,MA ChangBao2,HUANG Jing1,3,LIU KaiLou1,4,XUE YanDong2,LI DongChu1,3,LIU LiSheng1,3,ZHANG Lu1,3,LIU ShuJun1,3,ZHANG HuiMin1,3()
)
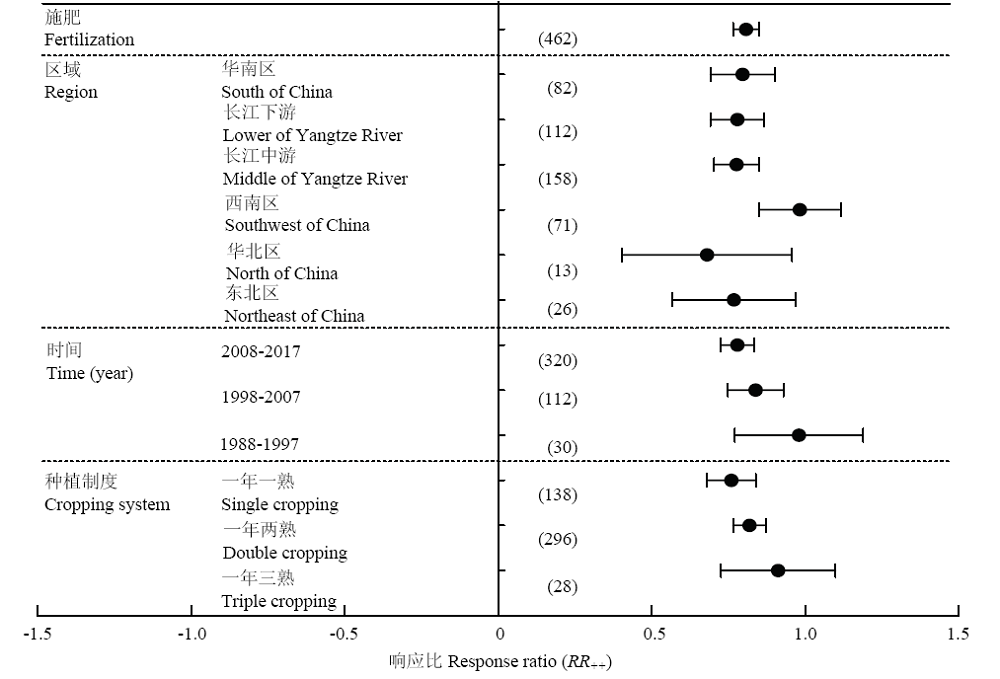
图2. 不同区域、时间和种植制度下水稻产量对施肥的权重响应比
点和误差线分别代表响应比及其95%的置信区间,如果误差线没有跨越零线表示处理与对照存在显著差异;括号内的数值代表样本数。下同
Fig. 2. Response ratio (RR++) of rice yield in response to fertilization practices in different regions, times, and cropping systems
Dots with error bars denote the overall mean response ratio and 95% CI, respectively. The 95% CI that do not go across the zero line mean significant difference between treatment and control. The values in parentheses represent independent sample size. The same as below