)
)
)
)
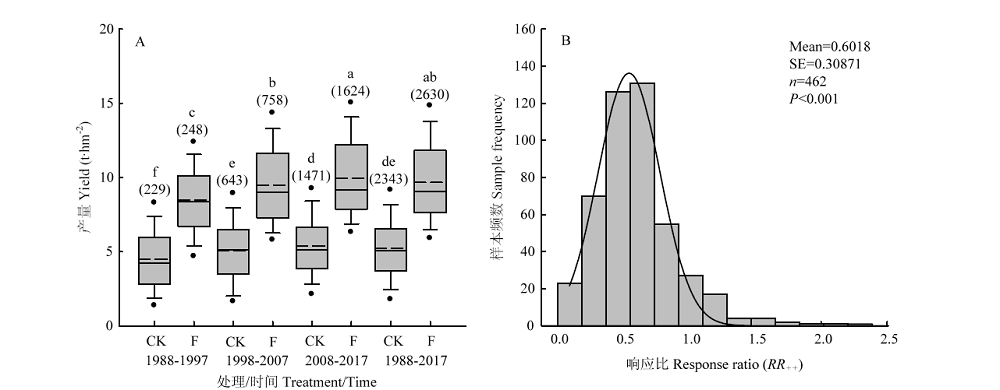
图1. 不同施肥处理水稻的产量
CK:无肥处理,F:常规施肥处理。不同的小写字母表示差异显著(P<0.05);箱形框中间的实线代表中位数,虚线代表平均值。箱形框上下边缘分别代表全部数据的75%和25%。箱形框上下两条线的边缘分别代表全部数据的95%和5%,上下两个实心点为异常值。括号里的数字表示该处理有水稻产量数据的个数
Fig. 1. The yield of rice under different treatments
CK means no fertilizer treatment, F means conventional fertilizer treatment. Different lowercases indicate significantly different (P<0.05); The solid line in the box represents the median value, and dash line represents the average value. The upper and lower of the box represent 75% and 25% of total data, respectively. The upper and lower of the lines represent 95% and 5% of total data, respectively. The upper and lower of the solid points represent the vertical outliers. The values in parentheses represent the number of rice yield data of each treatment